1. Communication between microcontroller and web browser.
This home automation system is using private IP Address. Therefore, the microcontroller (ESP32) and Web Browser (user) are required to connect to the router HIT-FRITZBOX-7490 or the internet which is in the same network with the router.
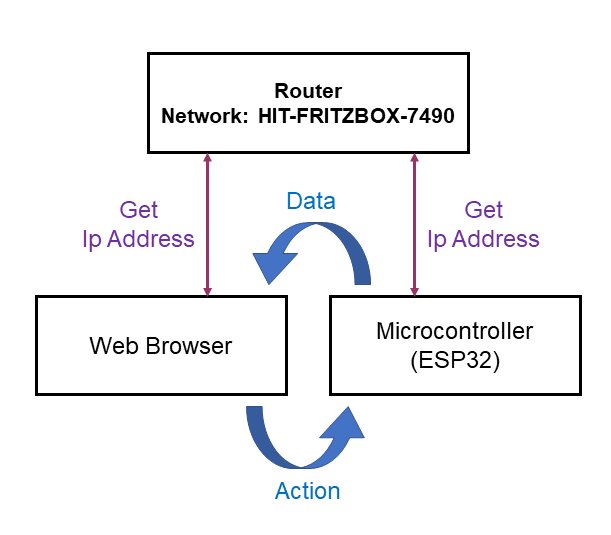
Figure 4.3.1 : Communication between microcontroller and web browser.
2. Main flow of the system.
When the microcontroller (ESP32) is started, it will automatically connect to internet and the OLED Display will show which router is the ESP32 connected.
After the ESP32 is connected to the internet, OLED Display will show the WiFi connection status and the IP Address of this system.
Then, user can key-in the IP Address to the web browser and click the connect button.
The web socket will connect both server (ESP32) and client (web browser) ,and enable 5 main function in the web browser.
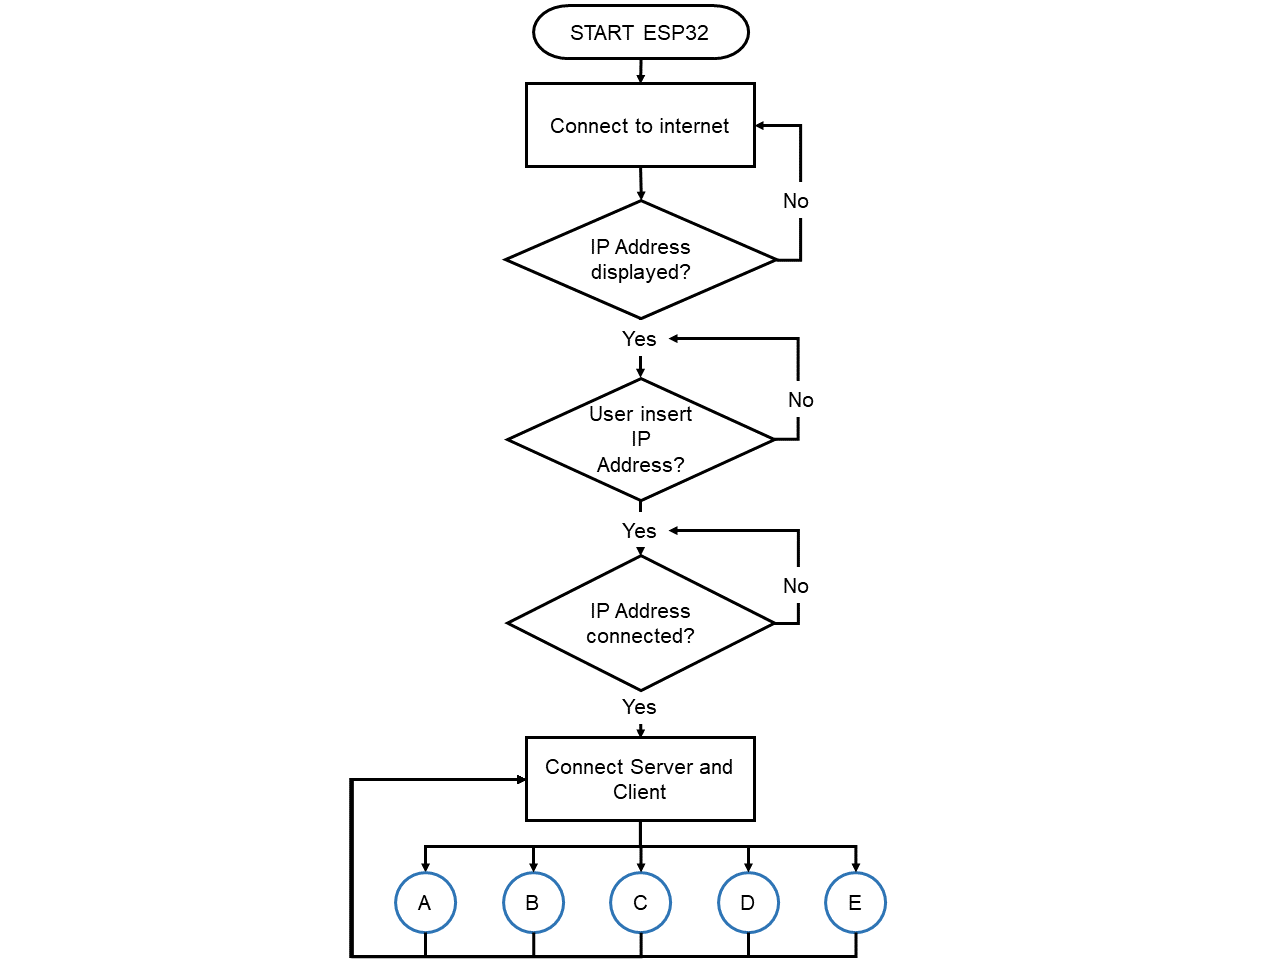
Figure 4.3.2 : Main flow of the system.
3. Light Intensity Status Display
In the system, there are light intensity sensor to show the brightness of the room.
When server and client is connected, the light intensity sensor will send the status to web browser.
If the brightness in the room is less than 35 Lux, websocket server will send "R0" to web browser, and the status of brightness "Dark, less than 35 Lux" will be displayed in the web browser.
Furthermore, if the brightness is within 35 to 55 Lux, web browser will receive "R1" signal, and the brightness status "Dim, 35 Lux to 55 Lux" will be displayed.
In addition, when the brightness in the room is between 55 to 100 Lux, web browser will receive "R2" signal and display "Bright, 55 Lux to 100 Lux".
Lastly, the web browser will receive "R3" signal and display "Very Bright, more than 100 Lux" as the brightness status, when the light intensity in the room is more than 100 Lux.
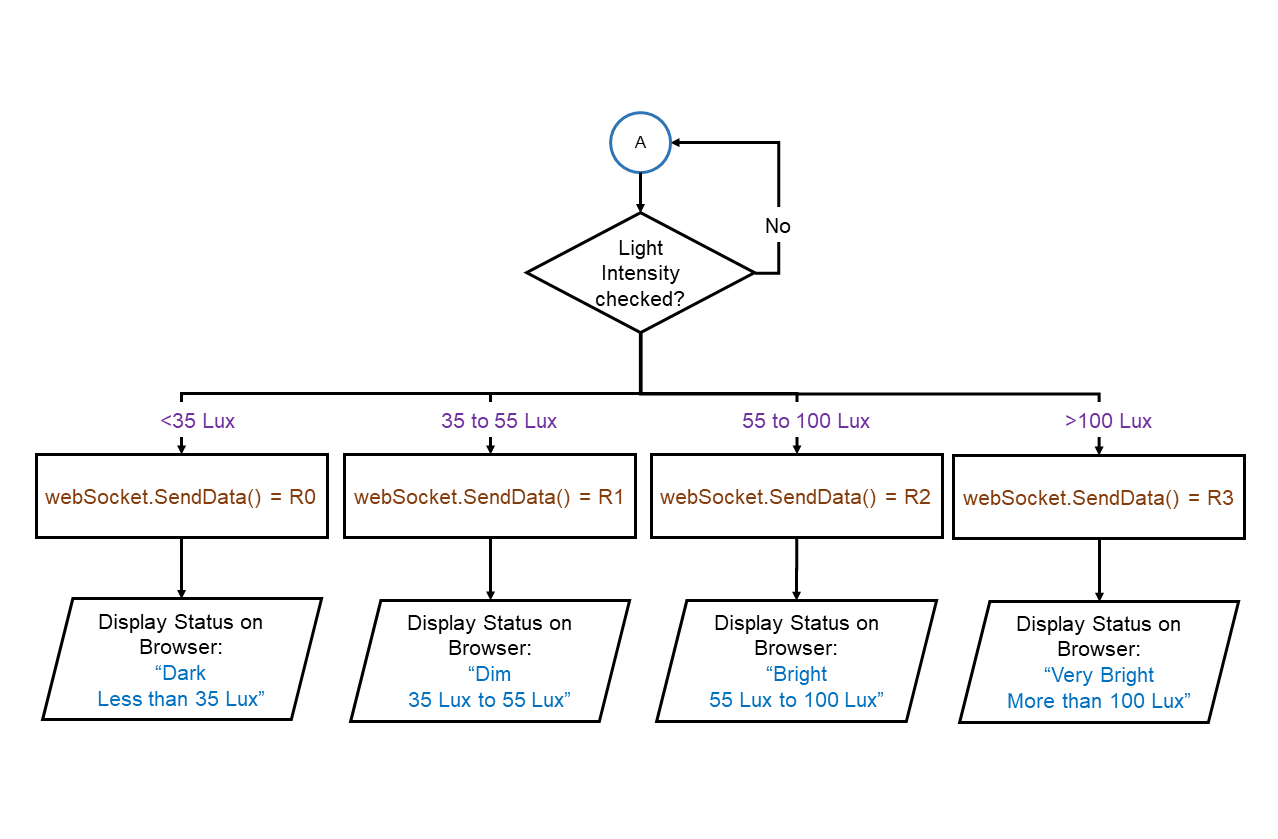
Figure 4.3.3 : Light Intensity Status Display.
4. Automated Lighting Control Mode
Automated lighting control mode is control by both motion sensor and light intensity sensor.
When motion is detected and the light intensity is low in the room, microcontroller will send data "P0" to web browser and status "motion detected, light will on" will display in browser.
Then, the light will on and status of light on will display in browser.
Apart of that, web browser will receive "P1" and "P2" signal respectively, when the motion is detected but high brightness in room and
motion is not detected in room.
The browser will display the status as "Motion detected, brightness more than 35 Lux" and "no motion detected in your room" respectively and the light will off in both status.
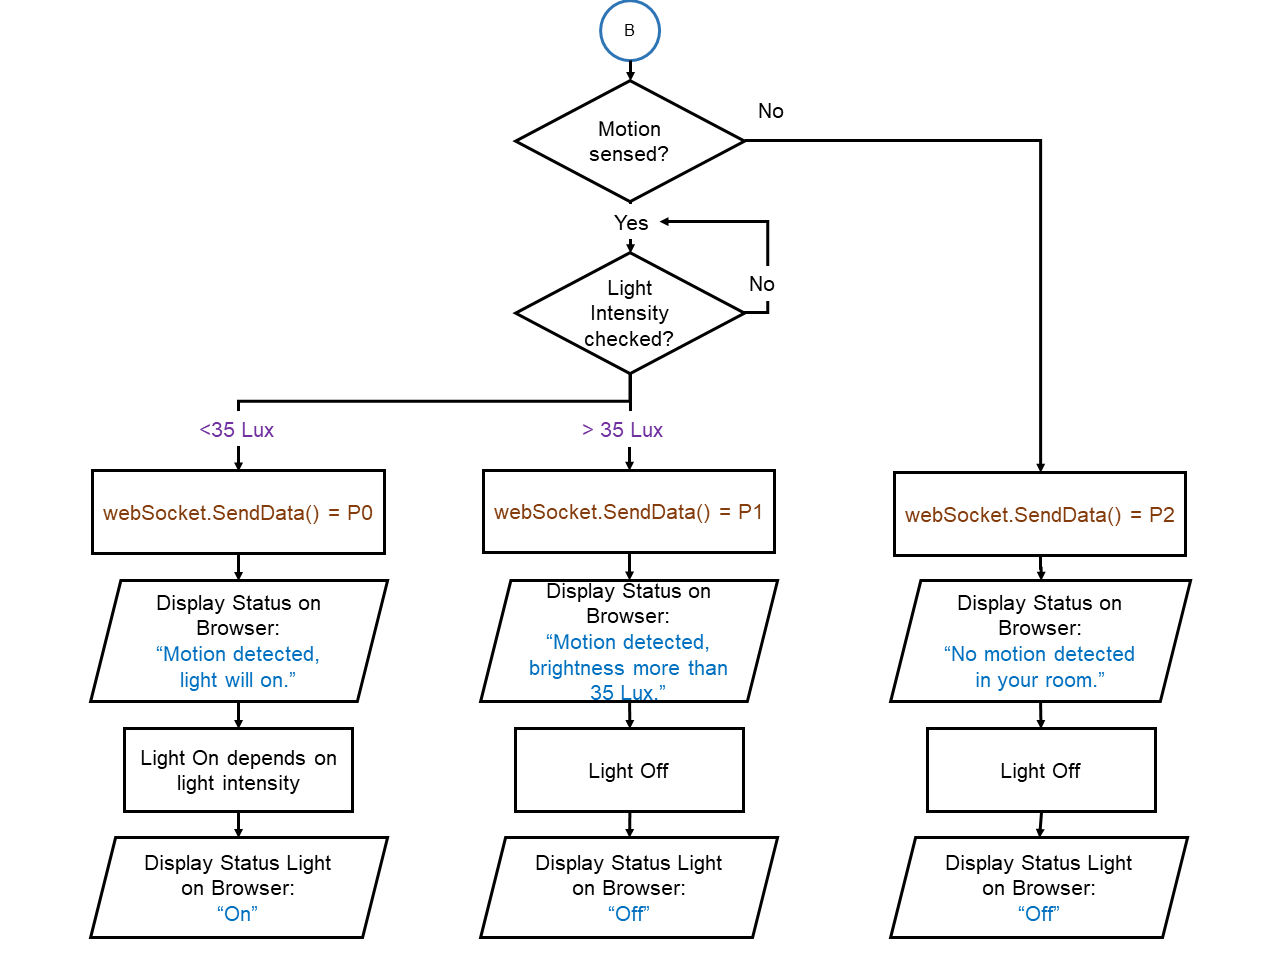
Figure 4.3.4 : Automated Lighting Control system.
5. Manual Lighting Control Mode
When user clicked on the "On" button, web browser will send signal "L1" to microcontroller and the light will on depends on the light intensity of the room.
If user clicked "Off" button, web browser will send signal "L0" to microcontroller and the light will off.
The browser will also show the status of light according to the light status.
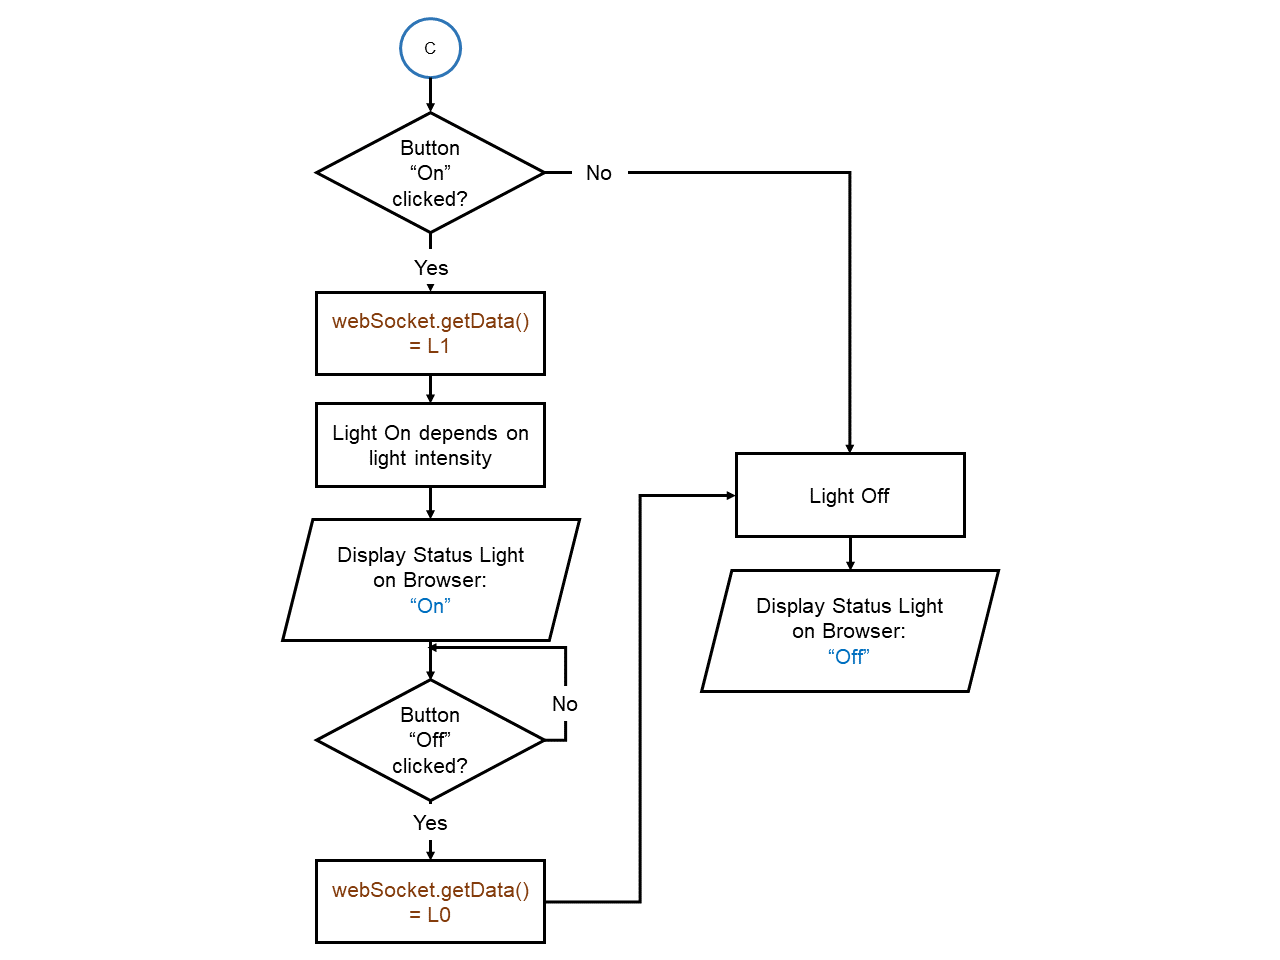
Figure 4.3.5 : Manual Lighting Control system.
6. Temperature Status Display
Temperature status display function is the function which can show user the information of temperature and humidity of their room in OLED and the status in browser.
In browser, it will display the temperature status as "Too cold, please on your heater","normal room temperature" and "Too hot, please off your heater", when the room temperature is lower than 18 °C, between 18 to 25 °C and more that 25 °C respectively.
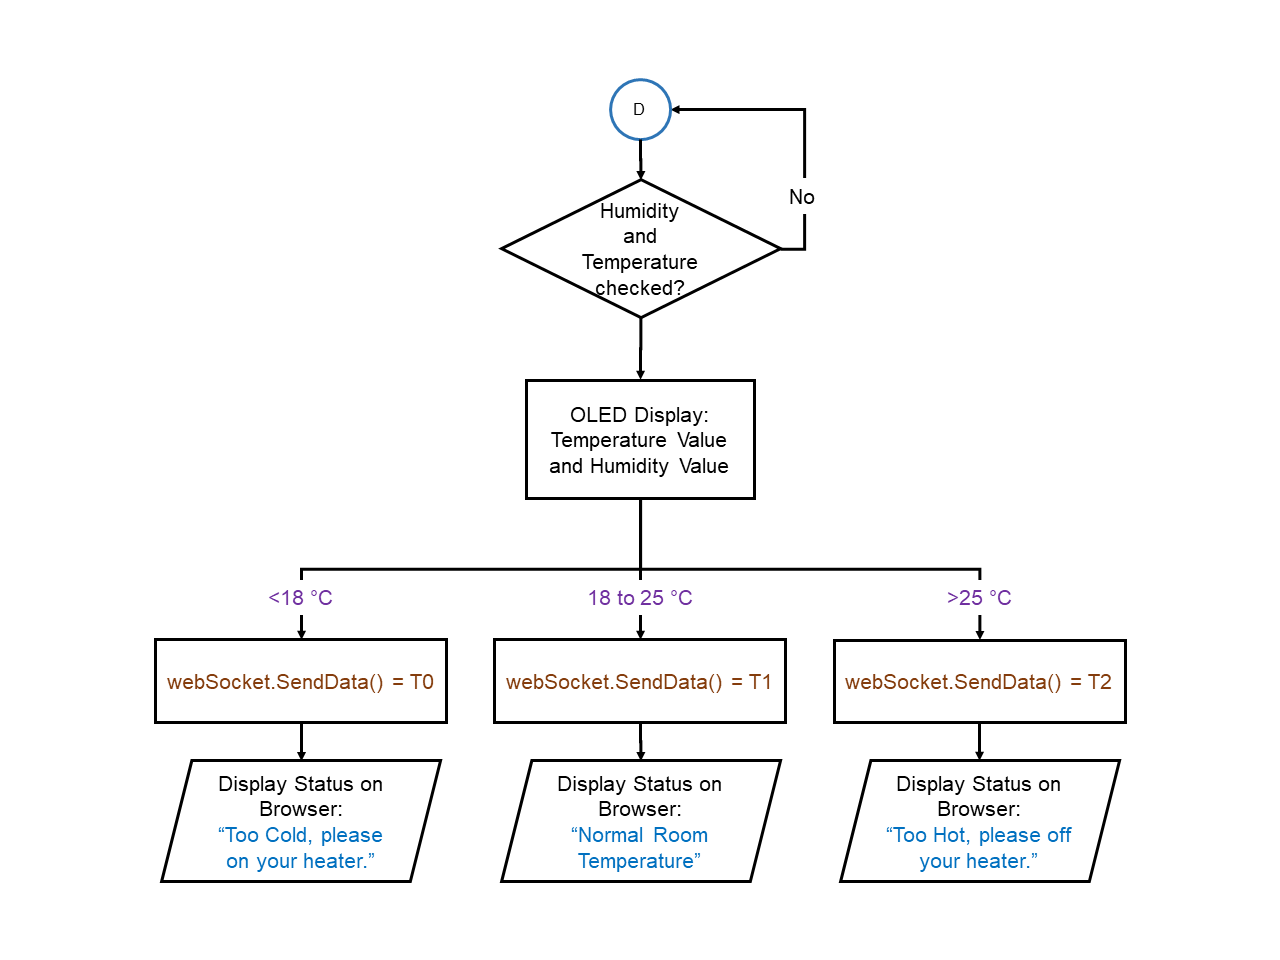
Figure 4.3.6 : Temperature Status Display.
7. Temperature Control Mode
In this mode, user can adjust the temperature of heater through the slider in the web browser.
Client will send the value of slider "S0" to microcontroller through websocket communication.
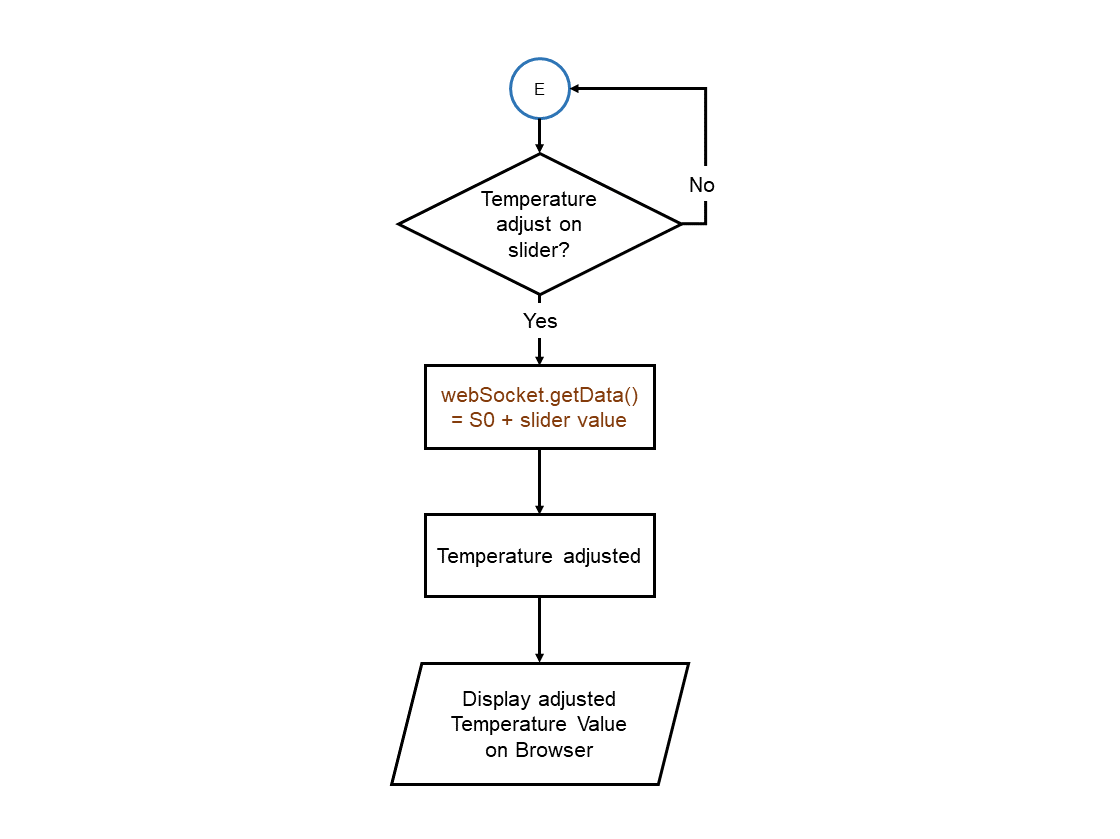
Figure 4.3.7 : Temperature Control Mode.

Download Software Flowchart.pptx